Assembling the data
During my short hiatus from TnA I pondered what sort of topics could make the basis of some interesting articles, and settled on “the most common scores in the Premier League”. Within this topic I wanted to answer several questions, including the effect of “transplanting” foreign managers to the PL in the 2000s and the arrival of oil & private equity money in the 2010s.
As usual when doing any sorts of analysis, high quality data is required. I managed to find such data here: https://github.com/footballcsv/england,1 where all the games since the inception of the Premier League in the 1992-1993 season are stored in .csv format.
After downloading the files corresponding to the Premier League (eng.1.csv) I settled on the following three decades:
– 1990s: seasons 1992/93 to 1999/00, a total of 3286 games
– 2000s: seasons 2000/01 to 2009/10, a total of 3800 games
– 2010s: seasons 2010/11 to 2019/20, a total of 3800 games
Grand total: 28 seasons and 10886 games
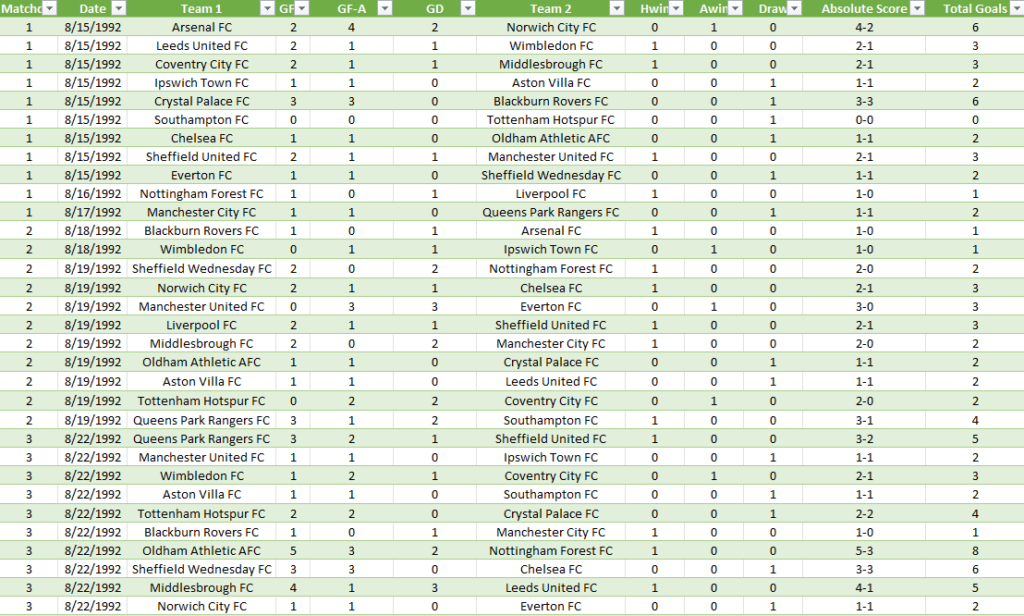
Each file had the following structure: “Matchday, Date, Team 1, FT, Team 2”, which was not enough for doing the analysis that I had wanted to do. So, I went about it by splitting the FT score into “Home Goals For” and “Away Goals For”, adding columns for Home & Away Wins and Draws, as well as adding every game’s goal difference and the total number of goals scored in a game.
Identical scorelines (i.e., 1-0 and 0-1) would create problems when trying to count the number of a score’s occurrence within a decade. To offset this I created an “Absolute Score” column. This column is nothing more than a re-arrangement of the full time score. For example, if a team lost 2-4 at home, the FT score would be registered in the original .csv as “2-4”. The “Absolute Score” would change this to “4-2”. Thus both scorelines “4-2” and “2-4” would be identified as “4-2”.
Below you can find an excerpt of how the final .csv file looks like.
How has scoring changed throughout the decades?
Now that we have our data nicely formatted, it’s time to do some analysis! First, let’s see how many goals have been scored by home teams throughout the decades, both in terms of absolute numbers and goals per 90 minutes.


It’s natural for the absolute number of 1990s goals to be lower compared to the 2000s and 2010s since we’re about 700 games short (even when considering the seasons with > 20 teams). Still, we can compare the latter two and we can see that in the 2010s there were 178 more goals scored by home teams (or 0.04 goals per 90). When comparing the goals per 90 throughout the decades, we can see that the 2000s did not really bring any significant increase in goals scored by home teams compared to the 1990s, while the 2010s have the highest number of goals per 90 scored by home teams of any decade.
Now that we’ve seen how goals scored by home teams have fluctuated, let’s move onto goals scored by away teams.

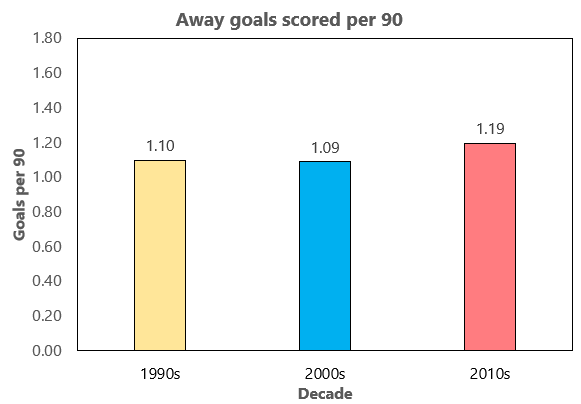
Here we can see some higher fluctuations. While there were 178 more goals scored by home teams in the 2010s compared to 2000s, there were 403 more goals scored by away teams in the 2010s compared to 2000s (or 0.1 more goals per 90!). Also, we can see that between the 1990s and 2000s, the rate of goals per 90 is almost identical, which suggests that from a goal scoring point of view, the Premier League stagnated in those decades.
Putting the home and away data together, we get the full picture of how goal scoring has changed throughout the decades.


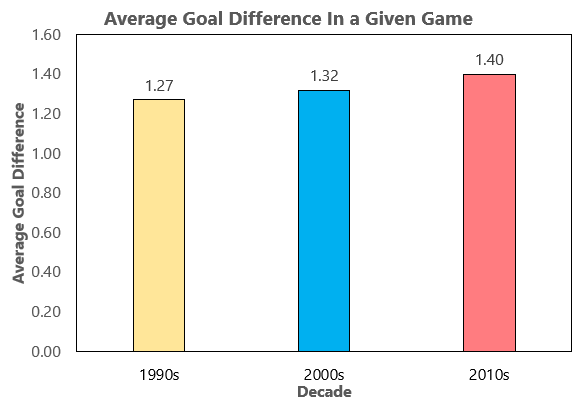
Relatively speaking, the 2010s were the most exciting to watch, as every game had on average 2.75 goals scored, compared to 2.62 in the 1990s and 2.59 in the 2000s. In addition, the average goal difference between any two teams has steadily increased since the 1990sm, reaching 1.4 in the 2010s. There are several potential reasons for this increase in goals scored, which I will expand on below.
Reason 1: Broadcasting money.
To understand just how much broadcasting money has contributed to the expansion of the Premier League to a global product that provides 2.75 goals per game, let us have a look at the money spent by broadcasters on rights.2
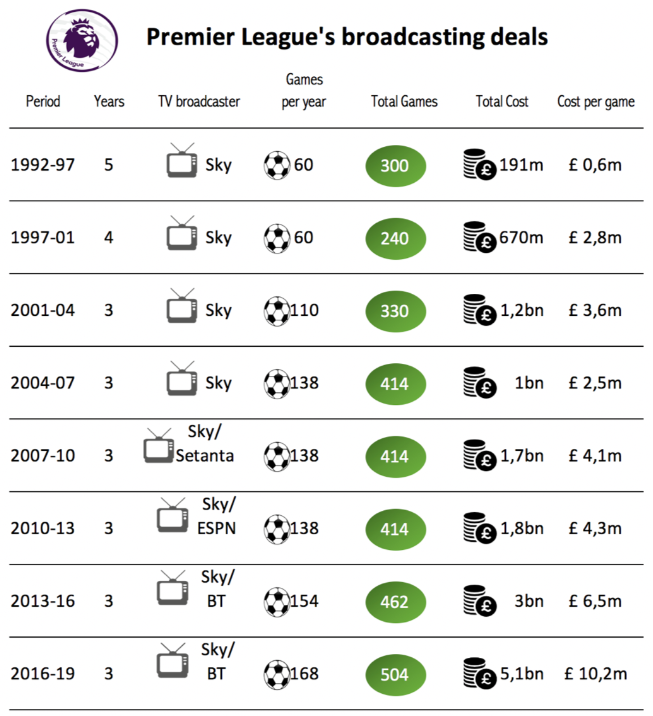
Compared to the 1992-97 period, when Sky paid ~ £600,000 per game (adjusted for inflation the number would be £1,069,144.76), the total cost per game in the 2016-19 period exceeded £10,000,000!
This money is split on a 50:25:25 basis, with 50% of the money equally split between all 20 PL clubs, 25% awarded on a merit basis (depending on the final placing in the league), and 25% awarded depending on how many games a team has televised in a given season.3
It then follows that the more money the Premier League receives from broadcasters, the more money clubs have to spend on infrastructure, wages, transfers, leading to more well-rounded clubs that can develop steadily. This scheme however also increases the gap between the already rich clubs (which finish at the top of the league every season) and the rest of the pack.
Reason 2: Oil & US private-equity money.
The Premier League forever changed in 2003, when oil magnate Roman Abramovich purchased Chelsea for £140,000,000. This transaction opened the door for foreign ownership in the Premier League (and lower leagues), with some owners being more honest than others.
In 2007, a Bleacher Report article4 counted 8 foreign owners in the Premier League: Chelsea, Liverpool, Manchester United, Manchester City, Aston Villa, Fulham, Portsmouth, and West Ham. In 2021, this number would rise to 15, the majority being US owners backed by private-equity & hedge funds.5
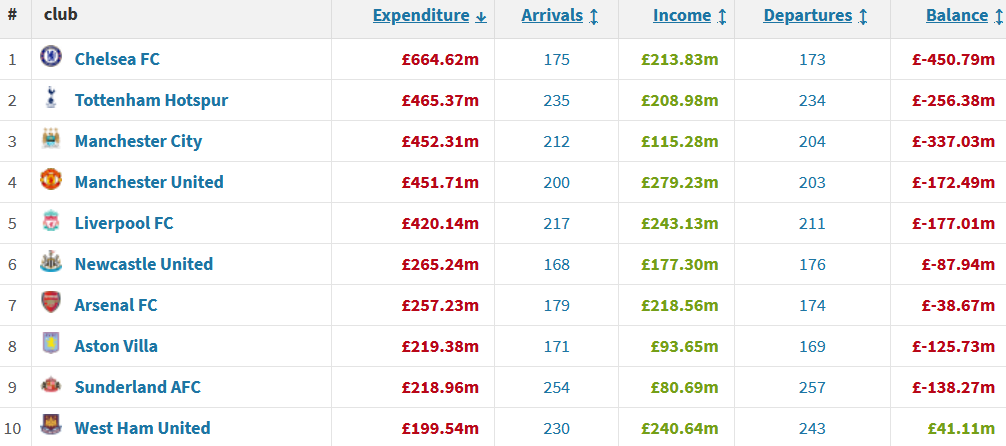
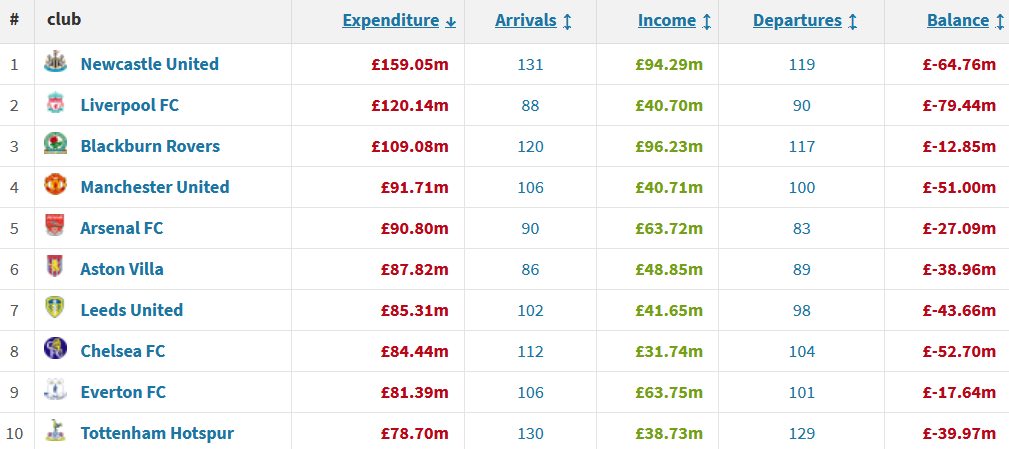
The money spent on transfers in the Premier League following these investments is staggering. In the 2010s, three clubs (2 x oil money clubs, 1 x US owner) had spent over £1,000,000,000 each on transfers, recording net losses of at least £270,000,000 on the transfer balance.6 We can compare this to the 2000s, where the most amount of money spent by a club on transfers was spent by Chelsea (£664,000,000), and to the 1990s, where the most amount of money was spent by Newcastle United (£159,000,000).7,8

Reason 3: Attracting overseas talent.
The broadcasting money and the money invested by owners have contributed immensely to attracting overseas talent to the Premier League, both managers and players.
When we look at the 1990s (and beginning of 2000s), there were only a handful of foreign managers that had made the move to the Premier League (not counting those from within the United Kingdom but outside of England). Arguably the most important managerial moment of the 2000s happened in August 2004 with the appointments of Rafa Benitez at Liverpool and Jose Mourinho at Chelsea (for a detailed discussion into these appointments I recommend “The Mixer” and “Zonal Marking”, both by Michael Cox).
Once owners got a whiff of fresh, continental tactics employed by foreign managers, the exodus of “route one”-employing English managers was set in motion. By the end of the 2009/10 season, from 24 managers who had been in charge of teams throughout the season, only 8 were English. By the end of the 2019/20 season, only 10/29 were English.
The same can be said about foreign players. The allure of “the best (and richest) league in the world” was strong for many players, who came over to the Premier League to show what they were capable of. High transfer fees, high wages, and the opportunity to work with world-class staff and players contributed to the development of a positive feedback loop.
Better and better players made their way into the Premier League, which in turn raised the quality and level of football.
Reason 4: Better facilities, pitches, nutrition, conditioning, sports science.
The last reason I consider of major importance in increasing the level of football throughout the decades is the improvements made in all the areas associated with football that are not necessarily seen by fans. State-of-the-art training grounds, improved nutrition personalized for every player, as well as advances made in sports science (player conditioning & recovery, coming back from injuries) have all contributed to lengthening the careers of players and raising the level of football.
Is there such a thing as “Home Advantage”?
The existence of “home advantage” in the Premier League has long been disputed. With access to game data from the past 28 seasons, we can check to see if teams playing at home have a higher percentage of winning.
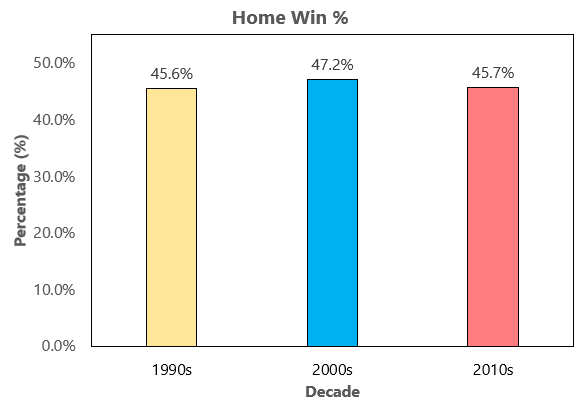
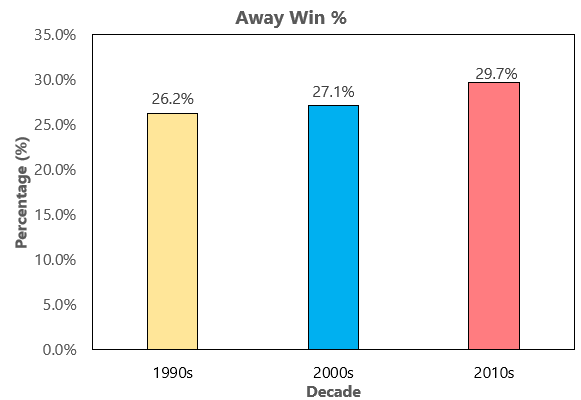
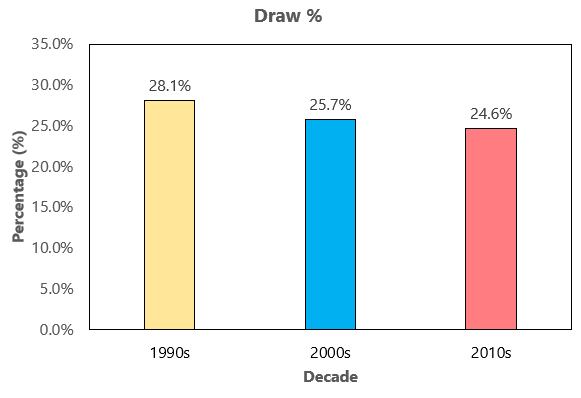
As can be seen in the graphs above, home teams win around 46-47% of the time, irrespective of the decade. The same cannot be said about away team wins, which have increased significantly from the 1990s to the 2010s (3.5%, from 26.2% in 1990s to 29.7% in 2010s), leading to a reduction in draws by the same percentage. This suggests that away teams are now likelier to go for a win instead of settling for a draw.
From these data, coupled with the number of goals teams score per game at home compared to those playing away, we can state that there is a “home advantage” in the Premier League.
What are the most common scores in the PL?
I’ve saved the best for last, and that is the score analysis. Before we delve into the most common scores, let’s first see how many unique scores are there across each decade.
| Decade | Number of Unique Scores | Most goals scored by a team in a game |
| 1990s | 30 | 9 |
| 2000s | 31 | 9 |
| 2010s | 32 | 9 |
Quite interestingly, the number of unique scores across the decades is remarkably similar, with 30 scores recorded in the 1990s decade, 31 in the 2000s, and 32 in the 2010s. In addition, within each decade, there has been at least one team to score 9 or more goals in a game (see table below).
| Entry | Season | Date | Round | Home Team | Away Team | Score |
| 1 | 1994/95 | Apr 3, 1995 | 32 | Man Utd | Ipswich | 9-0 |
| 2 | 2009/10 | Nov 22, 2009 | 13 | Tottenham | Wigan | 9-1 |
| 3 | 2019/20 | Oct 25, 2019 | 10 | Southampton | Leicester | 0-9 |
Another layer of analysis we can add is the highest scoring games within each decade. Perhaps surprising once more, the three decades are very similar.
In the 1990s, there were two games where 9 goals were scored, one being shown in the table above and the other being Man United’s 8-1 away win at Nottingham Forest on February 5, 1999 (Matchday 24).
In the 2000s, the highest scoring game was Portsmouth – Reading (season 2007/8, September 29, Matchday 8), which finished 7-4 for Pompey. Two games finished with a total tally of 10 goals, both involving Tottenham (one described in the table above and one in the 2007/8 season, where they defeated Reading 6-4 on December 29, 2007). Reading would go on to get relegated at the end of that season.
In the 2010s, there were 3 games in which 10 goals were scored:
1) Season 2011/12 – Matchday 3 (August 28): Man United – Arsenal finished 8-2 for the Red Devils
2) Season 2012/13 – Matchday 20 (December 29): Arsenal – Newcastle finished 7-3 for the Gunners
3) Season 2012/13 – Matchday 38 (May 19): West Brom – Man United finished 5-5
These scores are, of course, outliers and they represent an insignificant percentage of the total number of scores. The most common scores (and their % contribution to the total number of scores recorded in the decade) are given in the graph below.
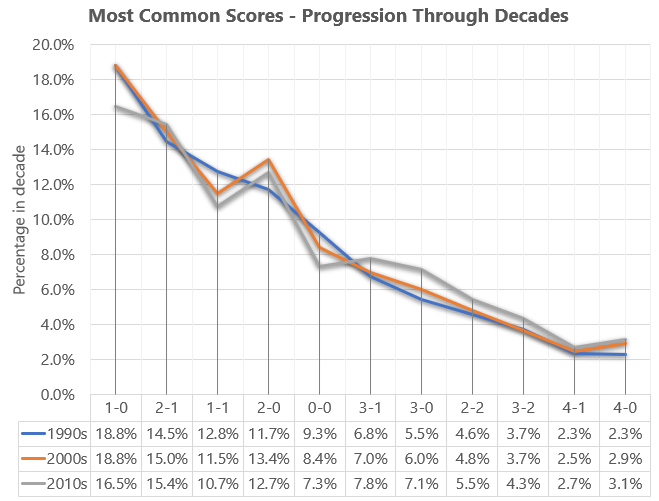
Let’s unpack the information from this graph. First, the 11 scores presented above account for >92% of the total scores recorded in each decade. Further, the most common score across all three decades is 1-0. You got it: the most boring score out there is a win by a 1 goal margin where the winning team keeps a clean sheet. However, an interesting trend is emerging: while the % contribution of the 1-0 score to the total number of games was unchanged for almost 20 years, it has seen a 2.3% drop between the 2000s and 2010s.
This drop has also coincided with a slight increase (between 1-1.6%) in higher scoring games (2-1, 3-1, or 3-0) and a decrease of 2% in 0-0 draws. These data are consistent with the graphs presented above, which showed that Premier League teams are now scoring more than they have in the previous decades, and that away teams are looking for the win instead of settling for a draw. In addition, as the football gets more exciting, the instances where neither team manages to score decrease.
The last thing we can determine is who is the most boring team in every decade. We will define this team by the number of 0-0s they get within a given decade and what % these scores represent out of the total games they’ve played in that decade. First, let’s see how many different teams have played in the Premier League.
| Decade | Number of different teams |
| 1990s | 33 |
| 2000s | 36 |
| 2010s | 36 |
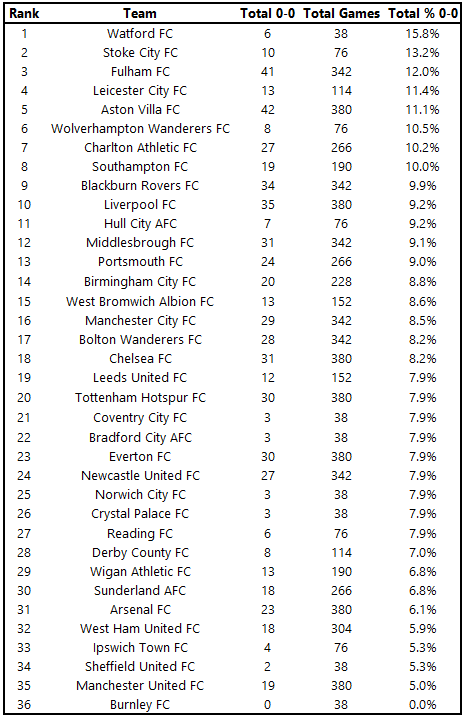
Again, very similar between decades. We now count the number of 0-0s each team has obtained (both home and away), and we divide those by the total number of games they played in the Premier League in that decade. Let’s have a look at 1990s:

The most boring team of the 1990s is …. Charlton Athletic, with 13.2% of their games ending in a 0-0! Very close behind we have Sheffield United, followed by Arsenal, Leeds, and Coventry City. Onto 2000s!
Perhaps surprising to nobody, the most boring team of the 2000s is Watford, with six (!) 0-0 draws in their only season in the Premier League. Stoke and Fulham follow closely, which again surprises no one. What is interesting in this table is that Charlton makes another appearance in Top 10, with 10.2% of all their games finishing 0-0. Onto 2010s!
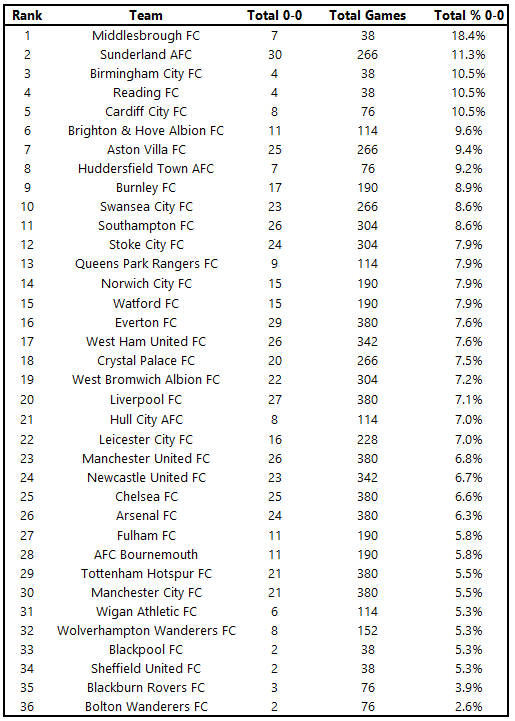
And the winner is … Middlesbrough! In their sole Premier League season of the decade (2016/17), Middlesbrough successfully ended seven games in a scoreless deadlock (18.4% of all their games), while also scoring only 27 goals the entire season.
Conclusions
If there are any conclusions to be drawn from this article is that the more things change, the more they stay the same. In my view, it is remarkable how the Premier League has remained fairly consistent throughout the years, with a slight ascending trend in scoring more goals / game. Overall, it can only help the Premier League product if the league produces exciting, high-scoring matches. The reality however is that, no matter the decade, Premier League teams will always be looking to eek out a result, even if it means holding out for a 0-0 draw.
References
- https://github.com/footballcsv/england
- https://www.sbibarcelona.com/newsdetails/index/403
- https://www.premierleague.com/news/102362
- https://bleacherreport.com/articles/2724-foreign-ownership-in-the-epl-a-double-edged-sword
- https://www.marca.com/en/football/premier-league/2021/10/10/6162d54b46163f1f7e8b45f0.html
- https://www.transfermarkt.us/premier-league/einnahmenausgaben/wettbewerb/GB1/plus/0?ids=a&sa=&saison_id=2010&saison_id_bis=2019&nat=&pos=&altersklasse=&w_s=&leihe=&intern=0
- https://www.transfermarkt.co.uk/premier-league/einnahmenausgaben/wettbewerb/GB1/plus/0?ids=a&sa=&saison_id=2000&saison_id_bis=2009&nat=&pos=&altersklasse=&w_s=&leihe=&intern=0
[ratemypost]
[ratemypost-result]